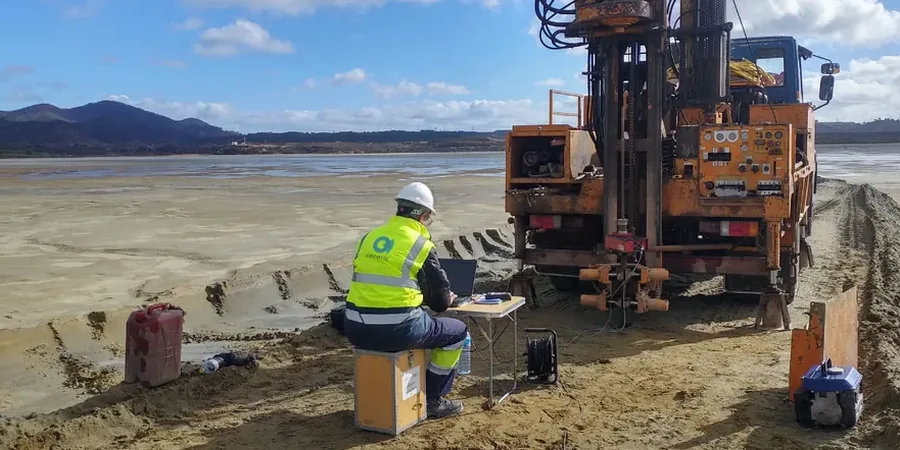
When we set up the geophones and trigger the source for a MASW line in Elk Grove, the first thing we look at is how the near-surface silts and clays respond at low strain. We use a 24-channel seismograph with 4.5 Hz vertical geophones spaced tight, typically 1 to 2 meters, because we need to capture the velocity contrast between the younger basin fill and the older, stiffer alluvium underneath. The raw field records come straight into our lab for dispersion curve picking, inversion, and a final Vs30 calculation that feeds the site class under ASCE 7-22 Chapter 20. In Elk Grove, where the groundwater table often sits shallow across the Laguna Creek drainage, we run multiple lines per lot to check lateral variability. Before breaking ground, it makes sense to pair the shear-wave data with a CPT test to calibrate the thin silt seams that a surface wave method might smooth over, or a resistivity survey if there is old agricultural drain tile that could scatter the signal.
A measured Vs30 of 265 m/s versus a generic 200 m/s assumption can shave 10-15% off the base shear in a two-story commercial frame, and that number comes straight from our dispersion curves.
Local ground factors
Elk Grove grew fast through the 1990s and 2000s, pushing subdivisions east into the Laguna formation, an area where the soil map shows interbedded silts, peats, and loose channel sands deposited by ancestral streams. The older part of town, west of Highway 99, sits on more consolidated terrace deposits that behave differently during strong shaking. When we run a microzonation campaign across a parcel, we are essentially mapping the impedance contrast at the soil-bedrock interface and looking for soft layers that can amplify ground motion at the fundamental period of the structure. A site near the Cosumnes River floodplain can have a Vs30 of 180 m/s, while a lot two miles north on the Laguna Ridge might measure 310 m/s, and that difference changes the seismic coefficient in the lateral force-resisting system design. The California Geological Survey Seismic Hazard Zone maps identify liquefaction potential in the low-lying areas, but the actual dynamic amplification depends on the shear-wave velocity profile, which is what our lab delivers with the microzonation report.
Frequently asked questions
What is the cost range for a seismic microzonation study on a typical commercial lot in Elk Grove?
How does a site-specific Vs30 measurement differ from the USGS map value for Elk Grove?
The USGS Vs30 map is a proxy derived from topographic slope and does not capture local depositional features like the Laguna Creek paleochannels. Our field measurement with MASW gives you the actual shear-wave velocity of the 30-meter soil column under your footprint. This measured value often shifts the site class from D to a stiffer sub-class, reducing the design spectral acceleration coefficients Fa and Fv per ASCE 7-22 Table 11.4-1 and Table 11.4-2.
How many MASW lines do you need for a microzonation report?
The number depends on the parcel size and the expected lateral variability. For a single building pad under 5,000 square feet, two orthogonal lines centered on the footprint usually suffice. For a subdivision or a larger industrial building in Elk Grove, we typically run three to five lines spaced to capture transitions between soil units, especially if the property crosses between the Riverbank and Laguna formations. The layout is designed so the Vs30 contour map covers the entire project area at a resolution the structural engineer can use.
Can you run a seismic microzonation study if the site has existing asphalt or shallow fill?
Yes, we do it routinely. A thin asphalt cap does not block the surface wave propagation; we place the geophones on steel base plates with a thin gypsum couplant to ensure mechanical coupling. If there is uncontrolled fill thicker than 1.5 meters, we run a parallel test pit to log the fill material and adjust the inversion constraints so the velocity model does not misinterpret the fill as natural stiff soil.